
Recognizing Focal Liver Lesions with Structured Models
Paper
- Xiaodan Liang, Liang Lin, Qingxing Cao, Rui Huang, Yongtian Wang, “Recognizing Focal Liver Lesions in CEUS with Dynamically Trained Latent Structured Models”. IEEE TRANSACTIONS ON MEDICAL IMAGING (T-MI), 2015. Paper
SYSU-FLL-CEUS Dataset
(Download dataset here)
The dataset consists of CEUS data of FLLs in three types: 186 HCC, 109 HEM and 58 FNH instances (i.e. 186 malignant and 167 benign instances). The equipment used was Aplio SSA-770A (Toshiba Medical System), and all videos included in the dataset are collected from pre-operative scans.

Fig.1. Dataset examples
Abstract
This work investigates how to automatically classify Focal Liver Lesions (FLLs) as benign or malignant and characterize FLLs into three specific types in ContrastEnhanced Ultrasound (CEUS) videos, and aims at providing a computational framework to assist clinicians in FLL diagnosis. The main challenge for this task is that FLLs in CEUS videos often show diverse enhancement patterns at different temporal phases. To handle these diverse patterns, we propose a novel structured model, which jointly detects a number of discriminative Regions of Interest (ROIs) for the FLL and recognize the FLL based on these ROIs. Our model incorporates an ensemble of local classifiers in the attempt to identify different enhancement patterns of ROIs, and in particular, we make the model reconfigurable by introducing switch variables to adaptively select appropriate classifiers during inference. We formulate the model learning as a non-convex optimization problem, and present a principled optimization method to solve it in a dynamic manner: the latent structures (e.g. the selections of local classifiers, and the sizes and locations of ROIs) are iteratively determined along with the parameter learning. Given the updated model parameters in each step, the data-driven inference is also proposed to efficiently determine the latent structures by using the sequential pruning and dynamic programming method. In the experiments, we demonstrate superior performances over the state-of-the-art approaches. We also release the CEUS FLLs videos used to quantitatively evaluate this work, which to the best of our knowledge forms the largest dataset in the literature.
Model and Methods
We assume the FLLs can be represented by a number of ROIs in three vascular phases: arterial, portal venous, and late phases. We define an ROI as the minimum enclosing box of an FLL, which is depicted by the corresponding layout in the video. And we represent set of ROI with latent structured model(Fig. 2).
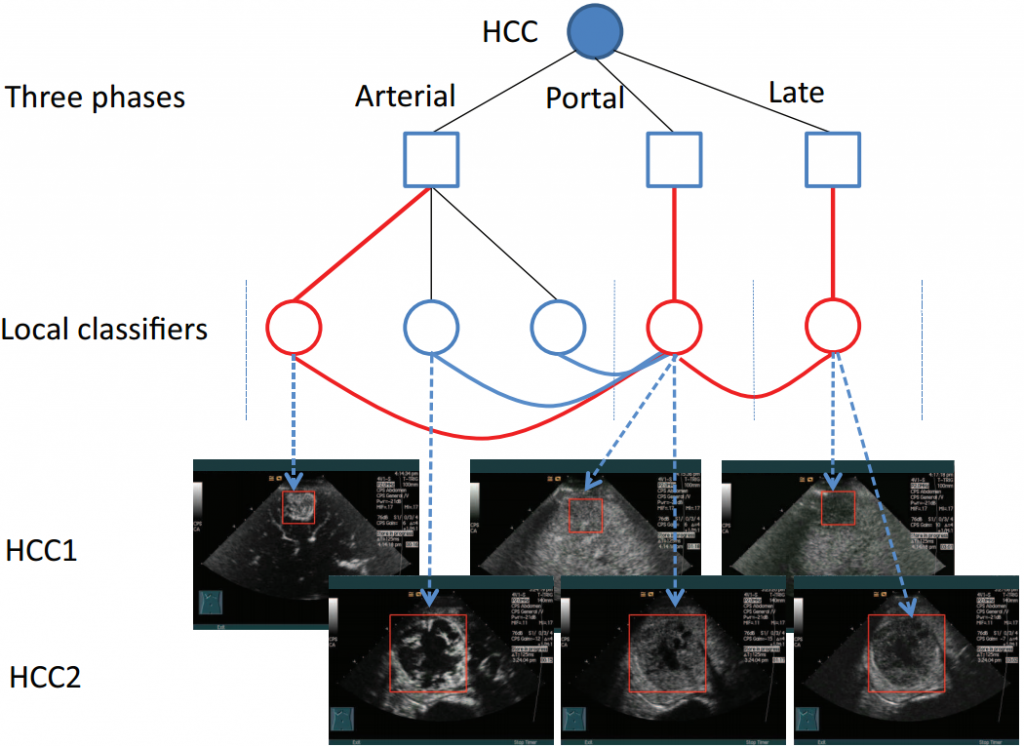
Fig. 2. An example of latent structured model generated by our approach.
From bottom to top, the local classifiers (denoted by the solid circles) at the bottom for localizing the candidate ROIs in each phase; then the most appropriate classifiers are selectively combined to conduct the FLL recognition. We utilize multiple local classifiers to capture the diverse enhancement patterns in the arterial phase. The curves between the local classifiers are used to incorporate temporal transitions between pairwise ROIs. The bold red circles and curves represent the selection of local classifiers during the inference.
Our algorithm trains the model in a dynamic manner: iteratively determining the model structures (i.e. re-producing the local classifiers) along with learning the model parameters. Specifically, the new local classifier is activated to better capture variations within training data. One example is illustrated in Fig. 3:
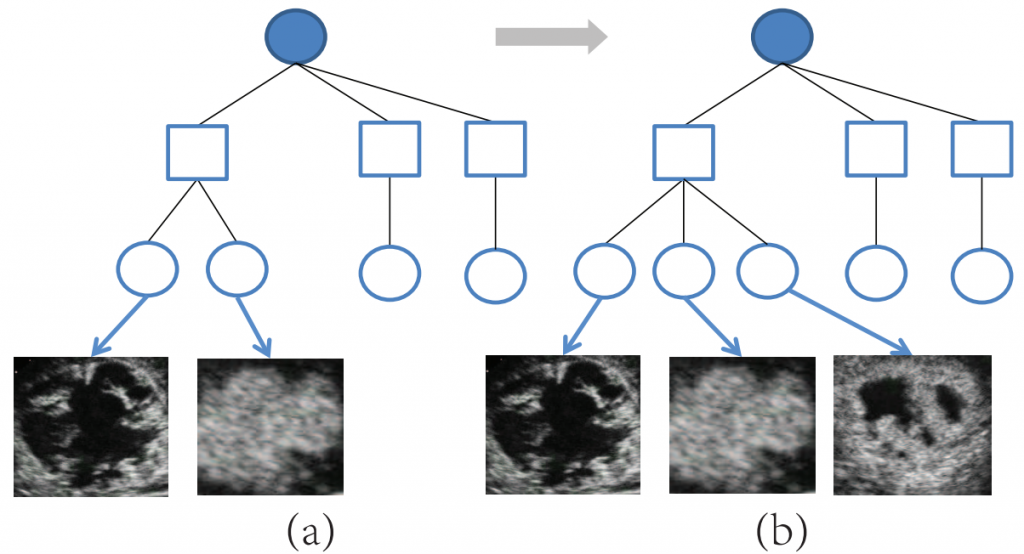
Fig. 3. An illustration of structural model learning. Our learned models for the HCC class are illustrated in different iterations. a) The learned local classifiers after the first iteration; b) a new local classifier is created to capture another pattern variance of FLL.
Experiments
Example results of HCC, HEM and FNH type. For each type, two subtypes (i.e. variations) and two examples are illustrated. The ground truth ROIs annotated by the radiologists are displayed in the first column. The red boxes of different phases represent the localised discriminative ROIs.
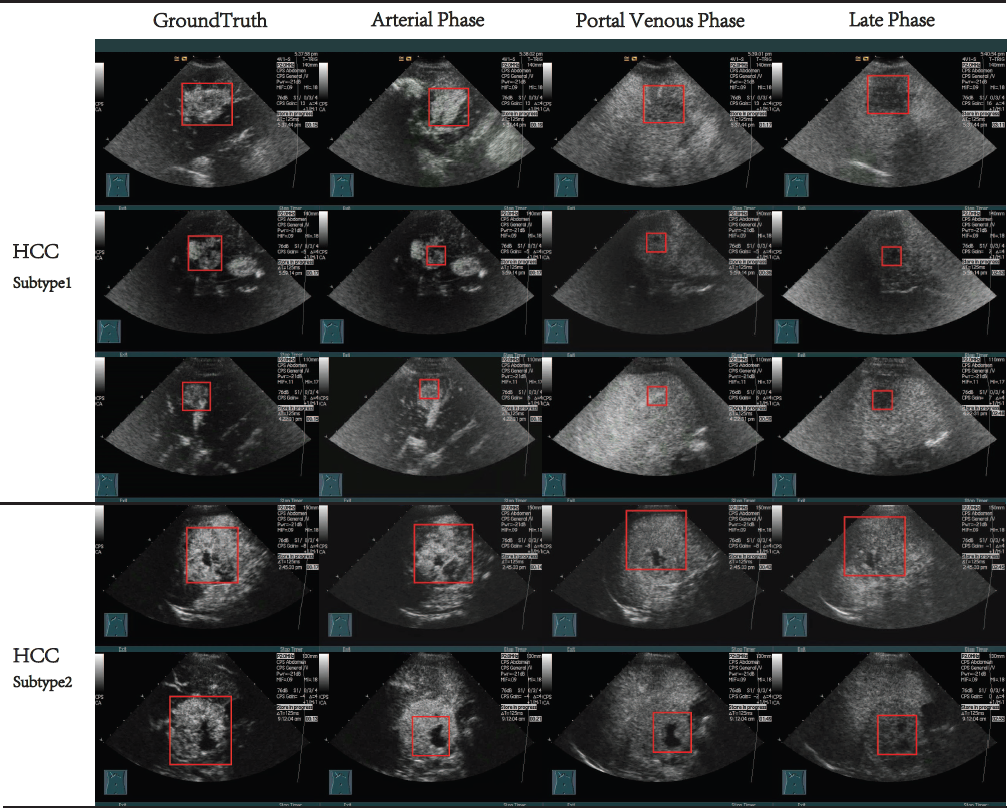
Fig. 4. Example results of HCC type.
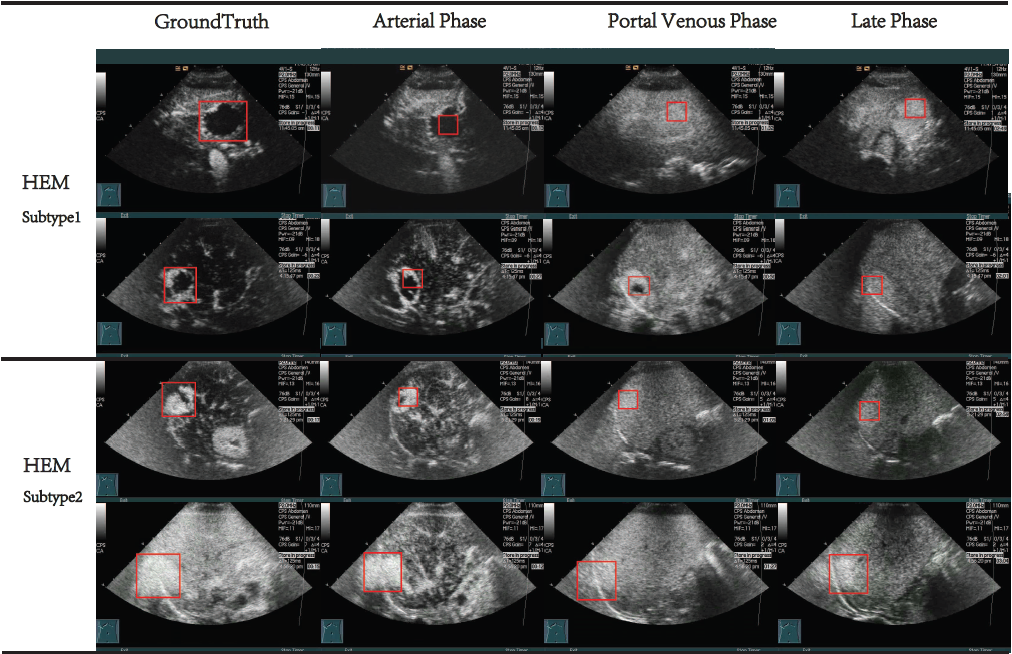
Fig. 5. Example results of HEM type.
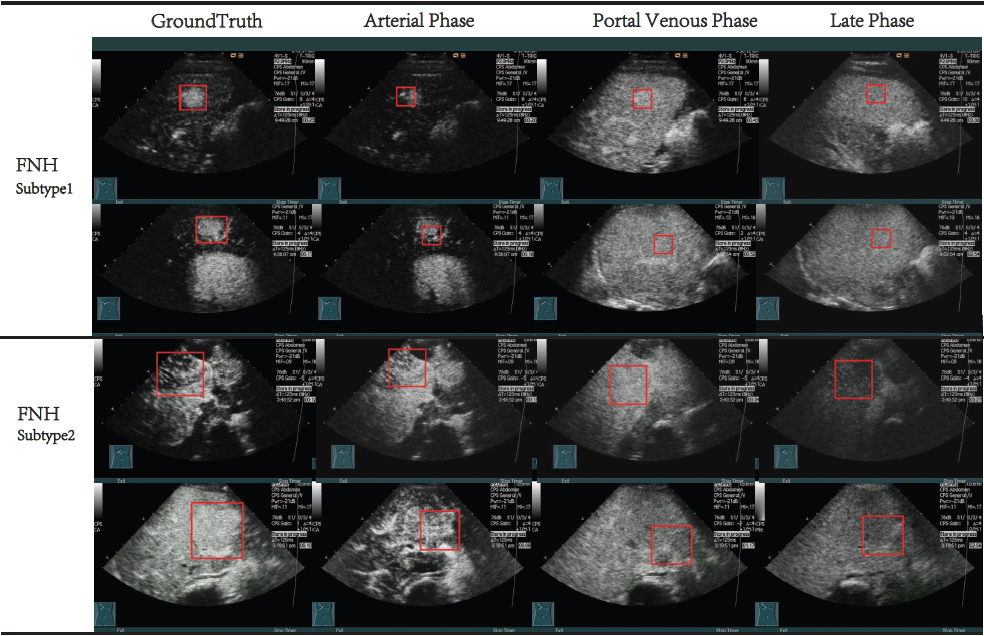
Fig. 6. Example results of FNH type.
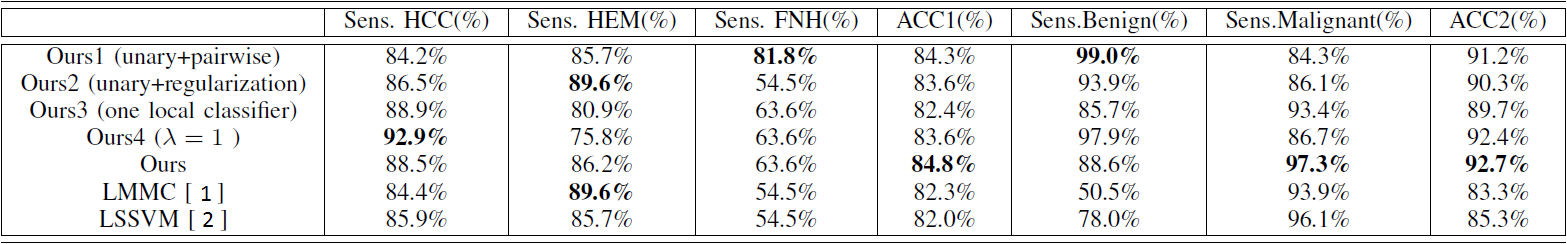
Table. 1. Comparisons of difference learning algorithm settings.
References
[1] Z. Guang-Tong, L. Tian, V. Arash, and M. Greg, “Latent maximum margin clustering,” Advances in Neural Information Processing Systems, pp. 28–36, 2013.
[2] C.-N. J. Yu and T. Joachims, “Learning structural SVMs with latent variables,” International Conference on Machine Learning, pp. 1169–1176, 2009.